

Key words : Project Selection Methods, Business documents, Benefits Management Plan, Present Value (PV), Net Present Value (NPV), Benefit Measurement Method, Economic Models, Murder board, Pear Review, Scoring Models, Discounted Cash Flow technique, Payback Period
Benefit Measurement Methods
It helps to make project decisions. We can use the method of ECONOMIC MODELS (it exists also three others methods like MURDER BOARD, PEAR REVIEW and SCORING MODELS). There is  Economics Models :
Economic Model N°  : Present Value (PV) and Futur Value (FV)
The money received in the future worth more than the money received today (Reason : The time value for money !).
So the Present Value (PV) is the value of the money today of a Future Value (FV).
This is also called ‘The discounted Cash Flow technique‘ and it allows us to compare the value of the future cash flow of the project to the today cash flow.
Example 1 : You will receive 500,00 euros in 3 years from now. The interest rate is 8%. What is the Present Value of this amount ?
- Solution :
- Future Value, FV = 500,00
- Interest rate, r = 8%
- Number of years, y = 3
-
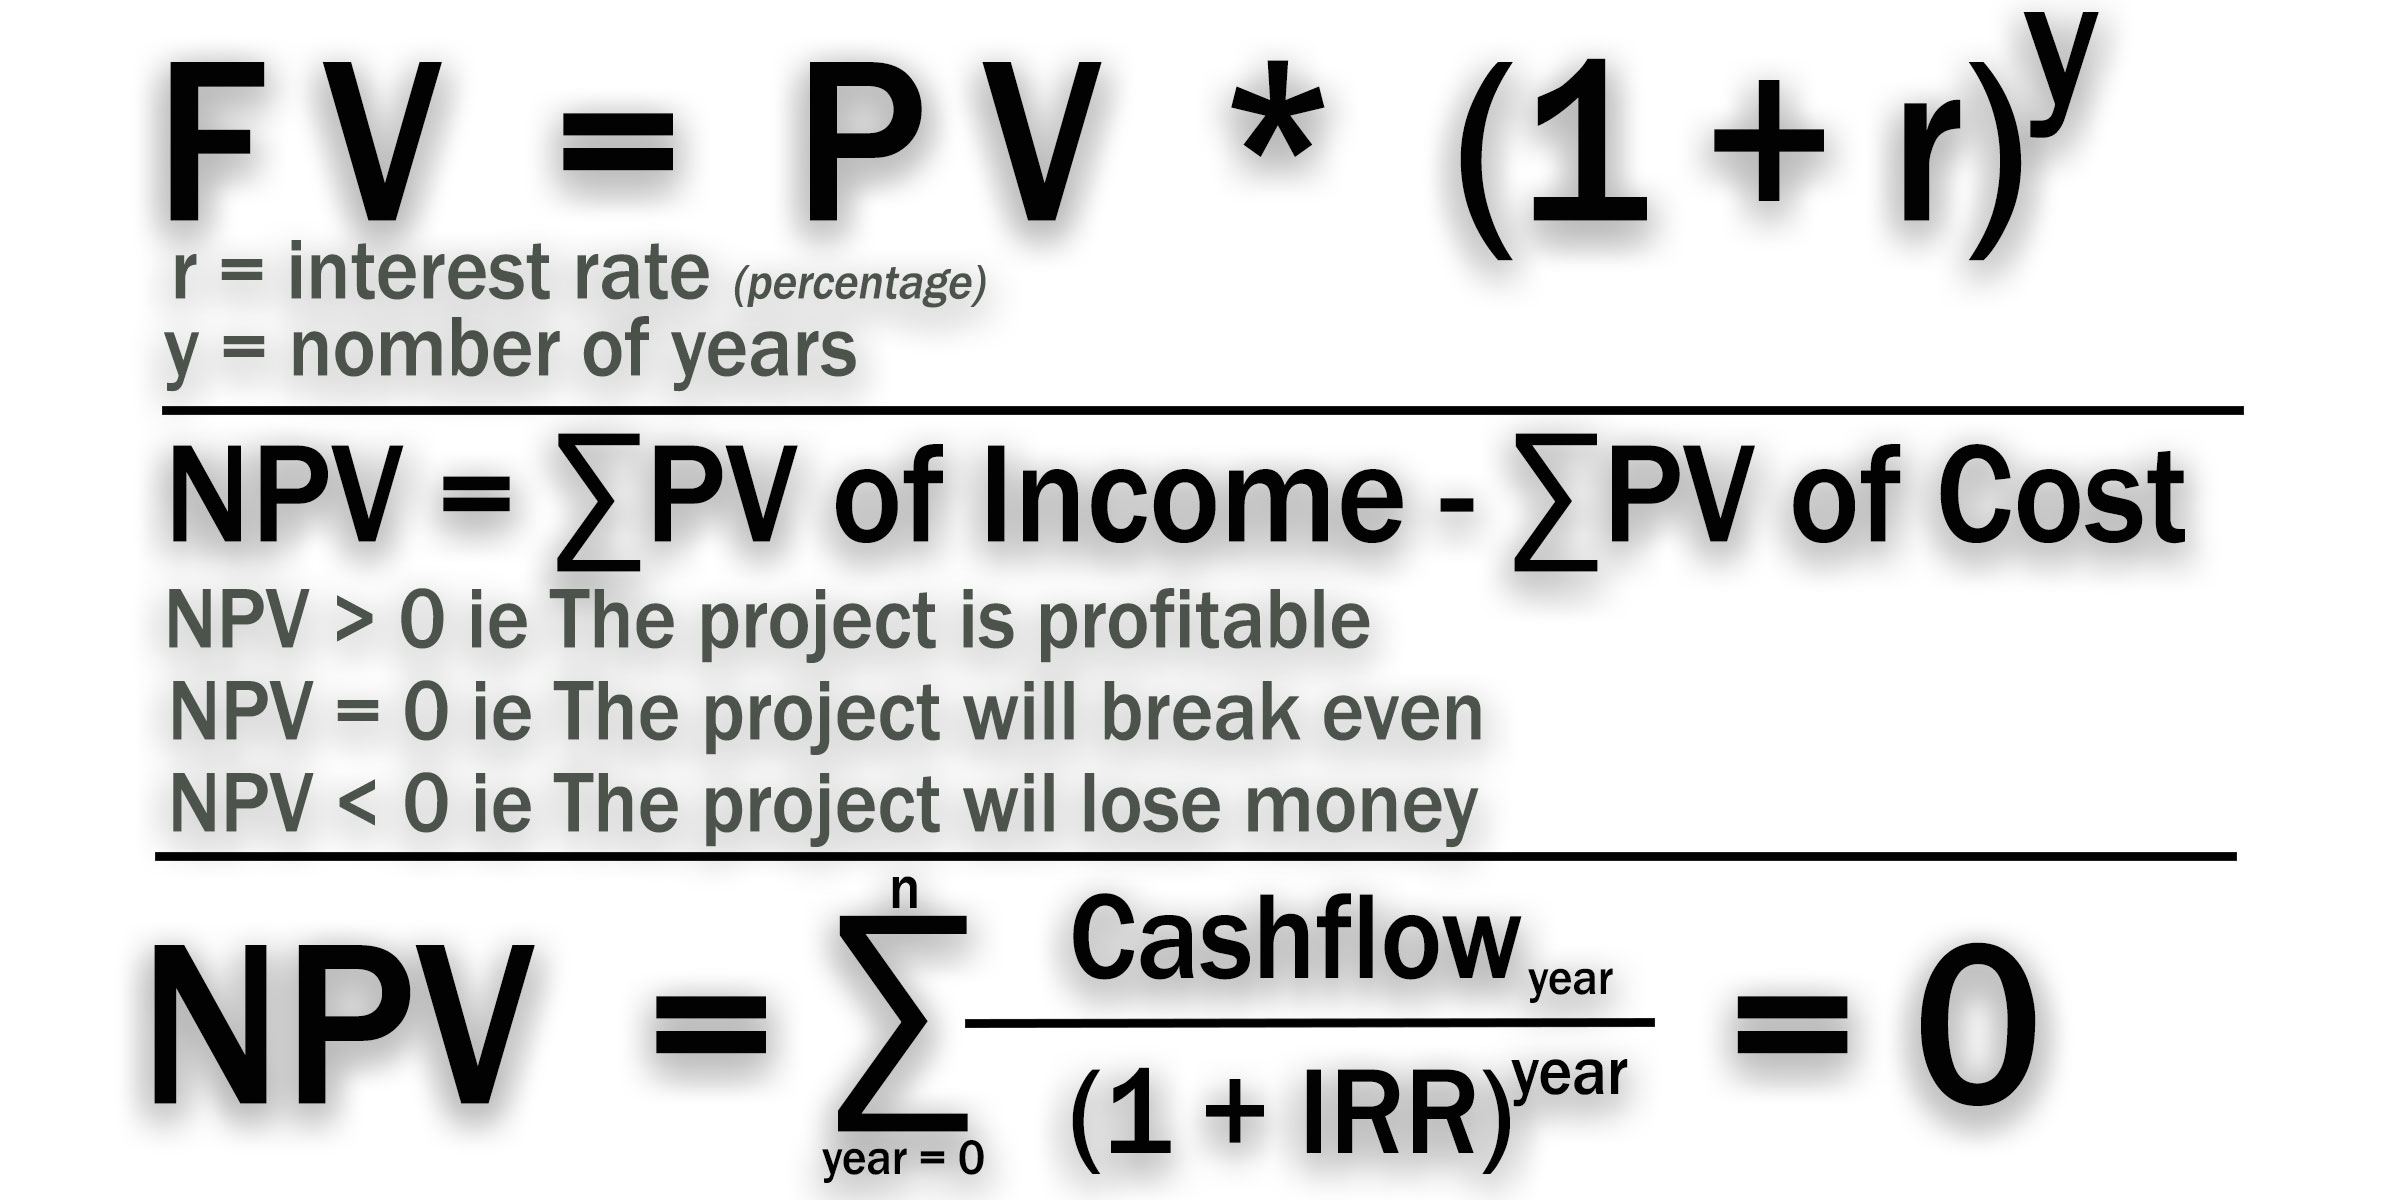
The formula is : FV = PV * (1 + r)y
That means : PV = FV / ((1 + r)y)
PV = 500 / ((1 + 0,08)3)
PV = 500 / ((1,08)3)
PV = 500 / ((1,08)3)
PV = 500 / (1,26)
PV = 396,916 euros
Example 2 : You are comparing two projects using the present value technique. Project P1 is expected to make 250.000,00 euros in three years. Project P2 is expected to make 300.000,00 euros in four years. If the interest rate is 13%, which project will you select ?
- Solution :
- For the projet P1, PV1 = 250.000 / ((1 + 0,13)3) = 173.262,541 euros
- For the projet P2, PV2 = 300.000 / ((1 + 0,13)4) = 183.995,618 euros
- So PV2 > PV1 ==> That means I will select the project with the higher Present Value : I will select the project PV2.
Economic Model N° : Net Present Value (NPV)
Net Present Value is a tool that helps to determine if a project is profitable or not.
NPV is the Present Value of the Total of all benefits minus the Costs over time periods.
The formula is :
NPV = ∑ Present Value of Income – ∑ Present Value of Costs
Hence, the larger the Net Present Value (NPV), the more profitable is the Project for the organization.
Exemple 1 : You have four projects to select from with the following informations : Project A, 5 years life with a NPV of 145.000 euros. Project B, 4 years life with a NPV of 150.500 euros. Project C, 2 years life with a PV of 40.000 euros and a NPV of 200.000 euros. Project D, 1 year life with a NPV of 100.000 euros. Which project will you select ?
- Solution :
- You have to select the Project with the higher NPV : So the Project B must be selected.
- Be careful : for the Project C, we are given the information that PV is 40.000 euros. PV is the Present Value and consider the time-value of money. That’s not necessary to pay attention on it in this exercice because we give the focus on the NPV in euro’s today.
Economic Model N° : Internal Rate of Return (IRR)
It is called ‘Internal‘ because it’s calculation doesn’t include environmental factors (such as inflation or interest rate) .
It is calculated by setting the NPV to zero and solving for the interest rate on the investment. Thus, IRR is the interest rate on a loan (vFr prêt) or investment where the cash flows meet the breakeven point (seuil de rentabilité).
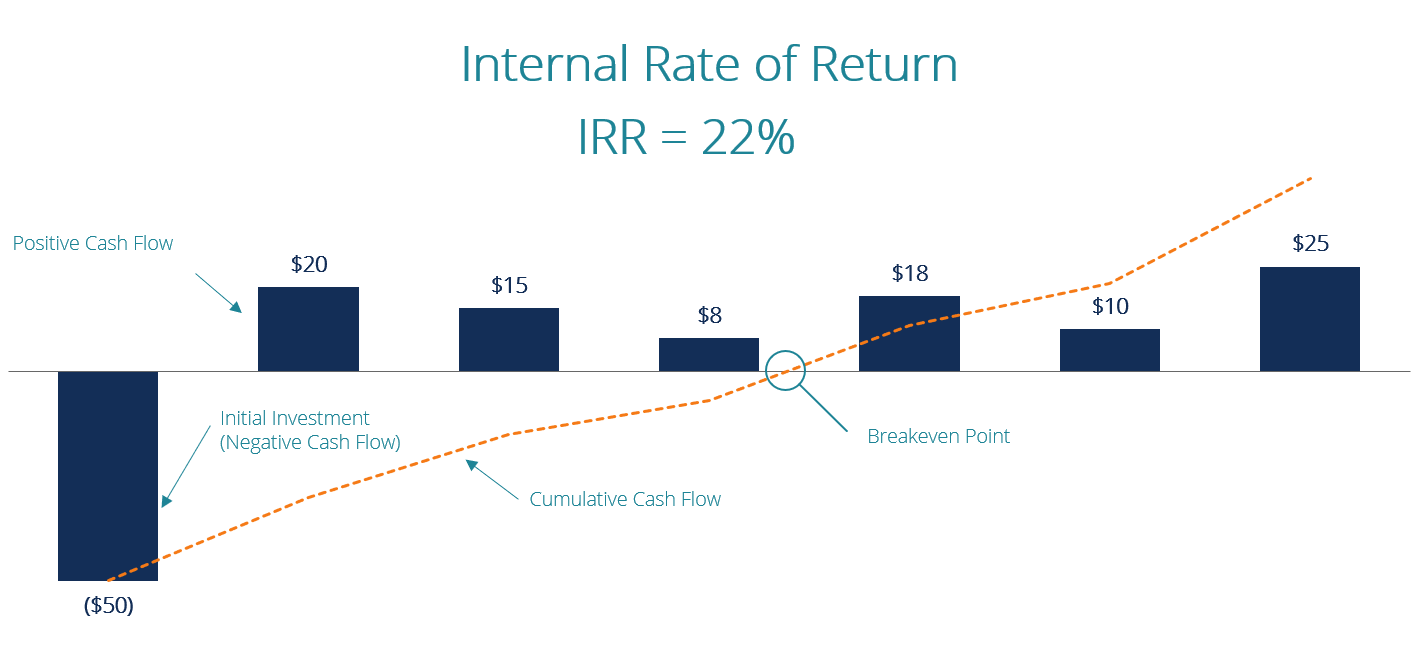
The higher the IRR, the more profitable the project is.
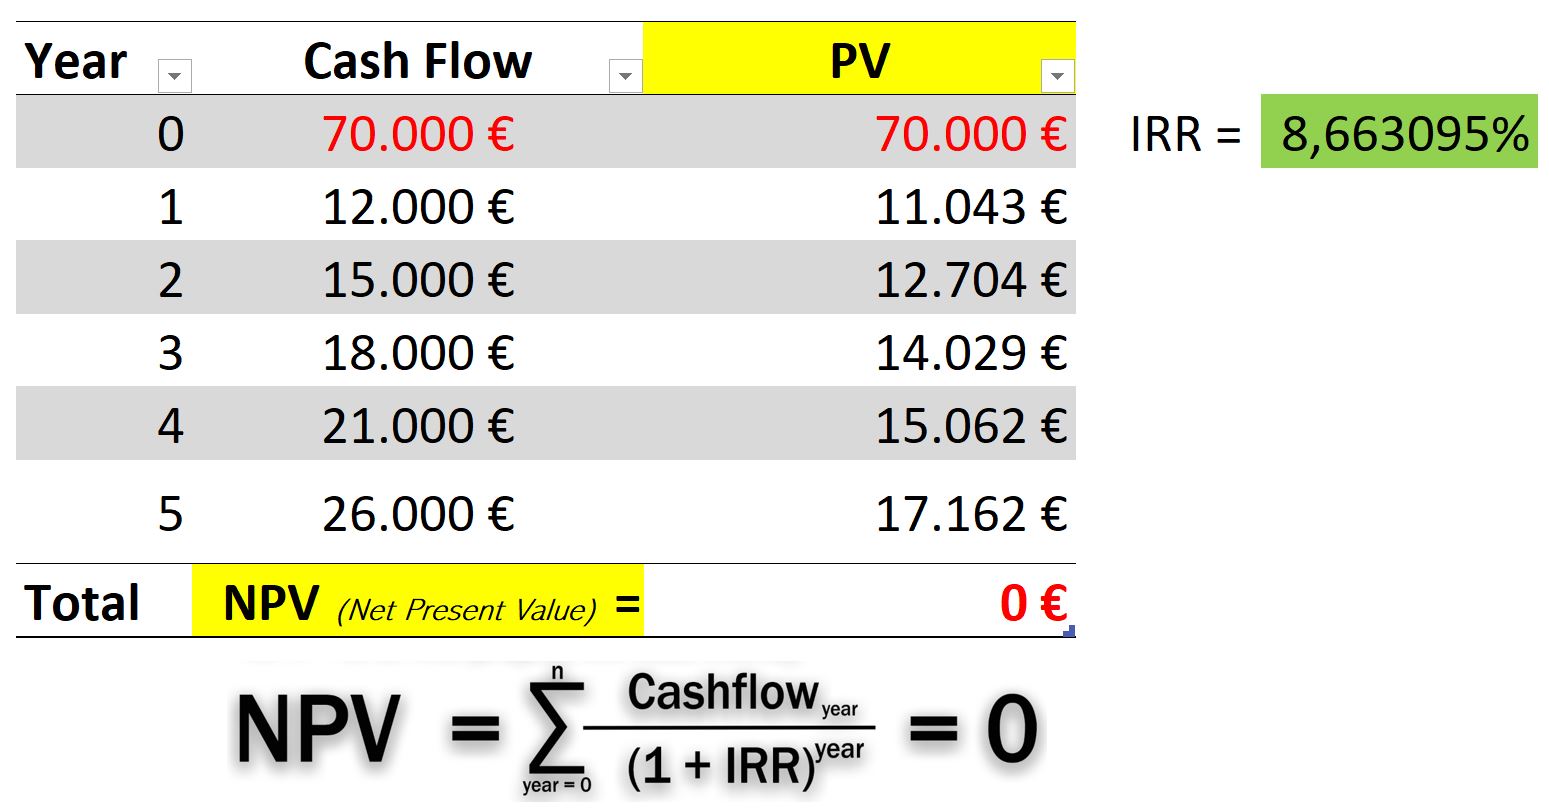
Example : Imagine that you put 70.000 euros down for an investment and have the following cash flows from the investment :
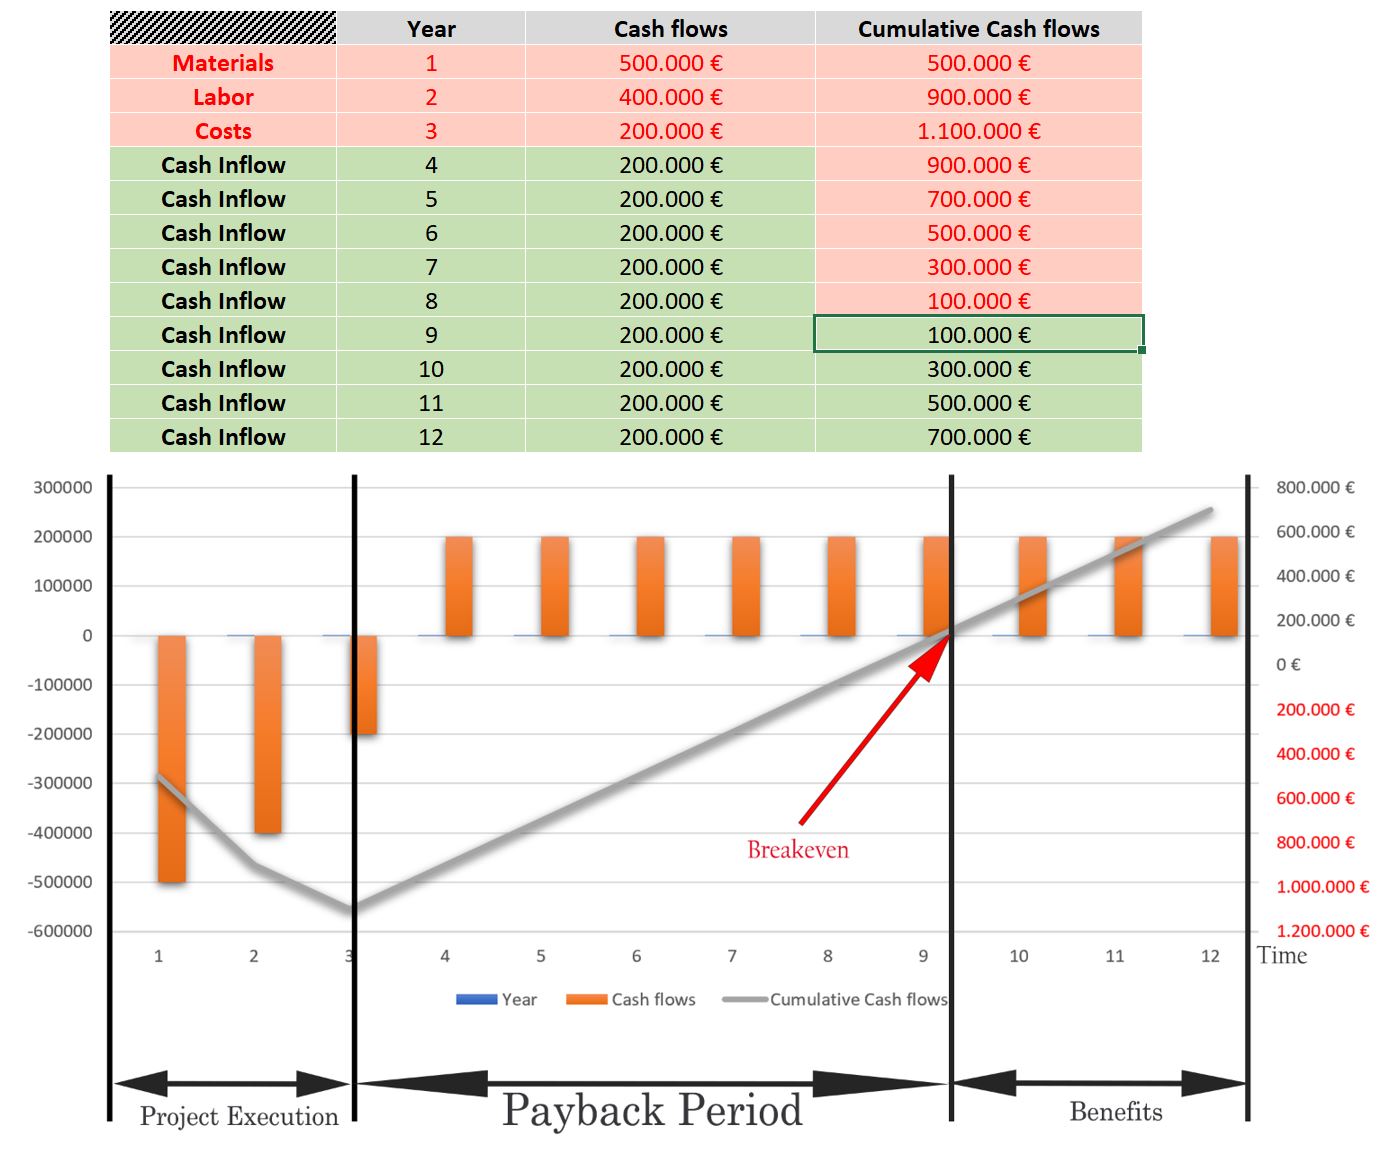
Economic Model N° : Payback Period
This is a measure of time, a measure of period : It shows how long it takes for a business to return its investment and initial costs of producing the Service, the Product or Result.
When choosing between projects or when choosing alternative ways of doing projects, then choose the project with the less Payback Period.
NB. Payback Period is the least precise of all Cash flows calculations because it doesn’t consider the value of the Cash inflows in later years (= time value money).
Example : A project initial investment is 1.100.000 euros with an expected benefits shown in the table below. What is the Payback Period. Answer : 9 years :
Economic Model N°  : Benefit-Cost ratio analysis
This is the analysis of the Benefits expected compared with the Costs of the project.
BCR > 1 means that the project is profitable, and the higher the BCR, the better is the project.
BCR = 1 means that the project will break even.
BCR < 1 means the project will cause the organization to lose money. Thus, it’s not consider as a good investment.